By Mike Jahrig KG5P
(Part 4 of a series)
Last month we discussed four types of filters and investigated their behavior using the NanoVNA. This month we will use the Nano to identify the values of some junk box inductors and capacitors to see if their markings agree with the NanoVNA display.
In the boat-anchor days, Heath had an Impedance Bridge kit. I built one in high school. Conceptually, it was a simple instrument containing four bridges and a zero-centered 100 microamp meter to determine balance. It also had a built-in 1000 Hz generator. The bridges included:
- A resistance or Wheatstone bridge.
- A capacitance bridge.
- Maxwell and Hay bridges for determining unknown inductance.
I must say it looked cool on my home bench.
Heath also had a “Q-Meter” in a similar-looking case that could do many of the same things. It measured inductance and capacitance, the “Q” of a coil (hence its name), measured inductor distributed capacitance, and a few other things you were dying to know. But the boat-anchor era was over when Perry Mason went off the TV. Fortunately, we can do all these things and more with the Nano.
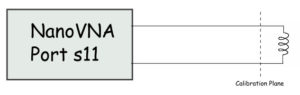
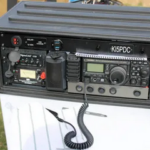
As with all test instruments, you must calibrate the Nano to return meaningful information. I did this with the setup to the left. Note the “Calibration” plane. I made mine using an oscilloscope test cable terminated with alligator clips. The connection on the other end has a male SMA connector that plugs into the Nano port S11. So I calibrated this kludge by connecting the alligator clips to the calibration “standards” at the calibration plane to eliminate most parasitic inductance in the cable. Yes, I know it would make an RF engineer go into apoplexy, but as you will see, it works.
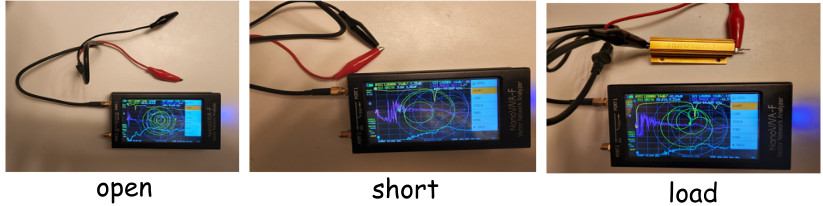
For the calibration, I left the alligator clips unconnected for the open, connected them at the calibration plane to short, and attached them to a 50-ohm resistor for the load.
Next, I set up the Nano using a broad sweep since the value of the inductor I that I wanted to measure was unknown. I entered an arbitrary stimulus from 10khz to 15 Mhz. I also went into the menus to set up trace 0 (yellow) to show S11 reactance, and trace 2 (green) to show Smith chart component value, trace 3 (purple) to show S11 phase angle. I let marker M1 default to display frequency. It is important to change any S21 source defaults to S11 since we are not doing any S21 (through) measurements.
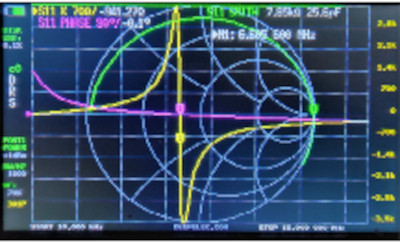
Look at what’s going on here. This picture tells us much. Look at the yellow S11 reactance trace and yellow marker 1. The yellow marker is on the bottom half of the Smith Chart when the frequency is about 6.6 mHz. The marker said the reactance is -941 ohms. The minus sign says the inductor is no longer inductive but capacitive at this frequency. So to act as an inductor, the frequency must be far below 6.6 mHz. Look at the purple S11 phase value. Where it crosses into the bottom half of the Smith chart, we see it is now –0.1 degrees. The negative phase value also tells us that the inductor is now capacitive. Finally, look at the tail of the green Smith chart plot. It is in the chart’s capacitive (lower half) area and has a value of 25.5 pf.
W can adjust the markers to see the inductance at 50 ohms and +90 degrees phase. We may drill down by adjusting the stimulus stop frequency determine the values with greater accuracy. As said before, this will happen much below 6.6 mHz.
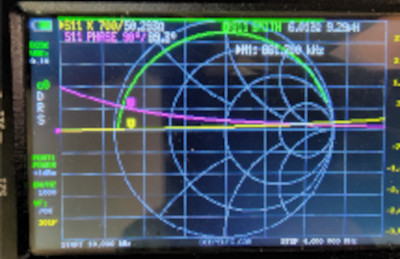
If we adjust the yellow marker M1 toward the left, we will be on the yellow trace before the big zig-zag. The big zig-zag is where the real-world inductor almost immediately turns into a capacitor. Keep dropping the S11 reactance value until it is somewhere above 50 ohms. It should look something like the one shown on the Nano left.
Look at where the Nano indicates the reactance is about 50 ohms. This reactance value coincides with a phase angle of about 90 degrees at a resonant frequency of 861.2 kHz.
Break out the pocket calculator, and we will do the math to prove it. You know from your General Class studies that inductive reactance, Xl = 2πfl, where f is the frequency in Hz and l is inductance in Henrys. We will make Xl 50 ohms. Isn’t everything 50 ohms? And we just determined l from the Nano Smith chart to be 9.28 μH = 9.28 x10⁻⁶ H.
Now we go back to Xl = 2πfl and, solving for l we get
l = Xl /(2πf)
Plugging values into the variables, we have l = 50/(2π * 9.28 x10-6) = 857.5 kHz, close enough to 861.2 kHz, taking the Nano’s resolution and rounding errors into account. Again, note the S11 phase angle is close to +90 degrees (inductive), and S11 Xl is close to 50 ohms.
But wait, there’s more. Remember when I arbitrarily calibrated the Nano sweep from 10 kHz to 15 MHz and came up with 9.28 μH? The granularity was too coarse at that range because the Nano had to fit that entire 15 MHz range into 301 data points. That means each data point is almost 50 kHz wide.
So I re-calibrated with the sweep from 10kHz to 4 MHz, making each data point about 13 kHz wide. I now got 10.1 μH for the inductor. What should the actual value be? Well, I lied; this was not an unmarked part. My junk box part did have markings. Some do, some don’t; this one did. This one’s markings were brown-black-brown-gold, making it a 10 μH inductor, ± 5% tolerance. I could repeat the process over a smaller range, but now 10.1 is within the ± 5% tolerance limits. Not mil-spec, but close enough for government work.
“So?” you ask, “Then why measure them? Why not just read the markings stamped on the device?”
There are lots of reasons, but here’s one. Remember Radio Shack? They used to sell miscellaneous part assortments in an “Archer Pack.” I bought some inductors in an Archer Pack for 50 cents more years ago than I remember. I figured I would sort them out in the distant future when I got around to it. The Archer Pack is still in my junk box, still unopened. Hey, you never know when you might need an unmarked inductor. Maybe it’s time I put the Nano to work.
Next, let’s talk about capacitors. Same song, second verse same as the first. Well, not exactly. I said inductors have positive reactance values. That is so, but capacitors have negative reactance values. That is because, in inductors, voltage leads current by 90 degrees. In capacitors, voltage lags current by 90 degrees. That’s why capacitive reactance has negative values from the voltage perspective. Something to do with ELI the ICE MAN, but I could never remember what the mnemonic meant, so I had to think about what was going on.
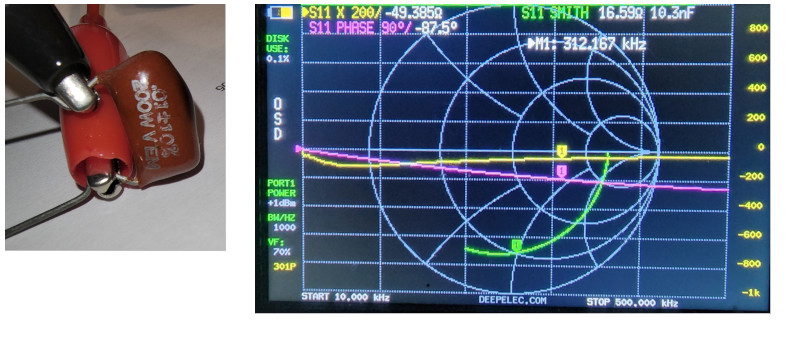
A 10 nf capacitor is in my test jig. Note that it is marked “.01,” which means .01 µF when written that way. If you move the decimal place three spots to the right (x1000) to get 10, and if you divide µF, which is 10-6 by 1000, you get 10 x 10-9 F or 10 nF. The VNA displays capacitance as nF or pF.
Also, look at the Nano display of this capacitor. The phase angle is at about -90 degrees since it is capacitive, and the green marker lies at 90 degrees on the lower half of the Smith Chart (meaning capacitive.) The yellow S11 plot tells us we are at -50 ohms reactive and capacitive. It also tells us this occurs at 312.167 kHz.
To sum up, we have shown how to determine the values of a couple of components. Unfortunately, our inexpensive versions of the Nano have some severe limitations. Some component values that are too low or too high can give erroneous results. These problems are not unique to the Nano. You can find them in most inexpensive testing devices that are not lab-grade quality,
Before I move to another topic, I want to spend one more session with you and describe the limitations of the Nano I found in my testing.
Stay tuned to this station. – de KG5P